

Agriculture Meets Technology & Data
Farming always looks easier when your plough is a pen and you’re several miles away from the field. What we aren’t taught is that there is more dignity in tilling a field than telling a story.
Agriculture is a primary source of livelihood for more than 50% of the population in India. It contributes 14% to the national GDP, contributes 44% to the employment, and is the backbone of the Indian economy.
However, agriculture contributes only 16% to the Gross Value Added. This means, there are things yet to be optimized in the Indian Agri sector.
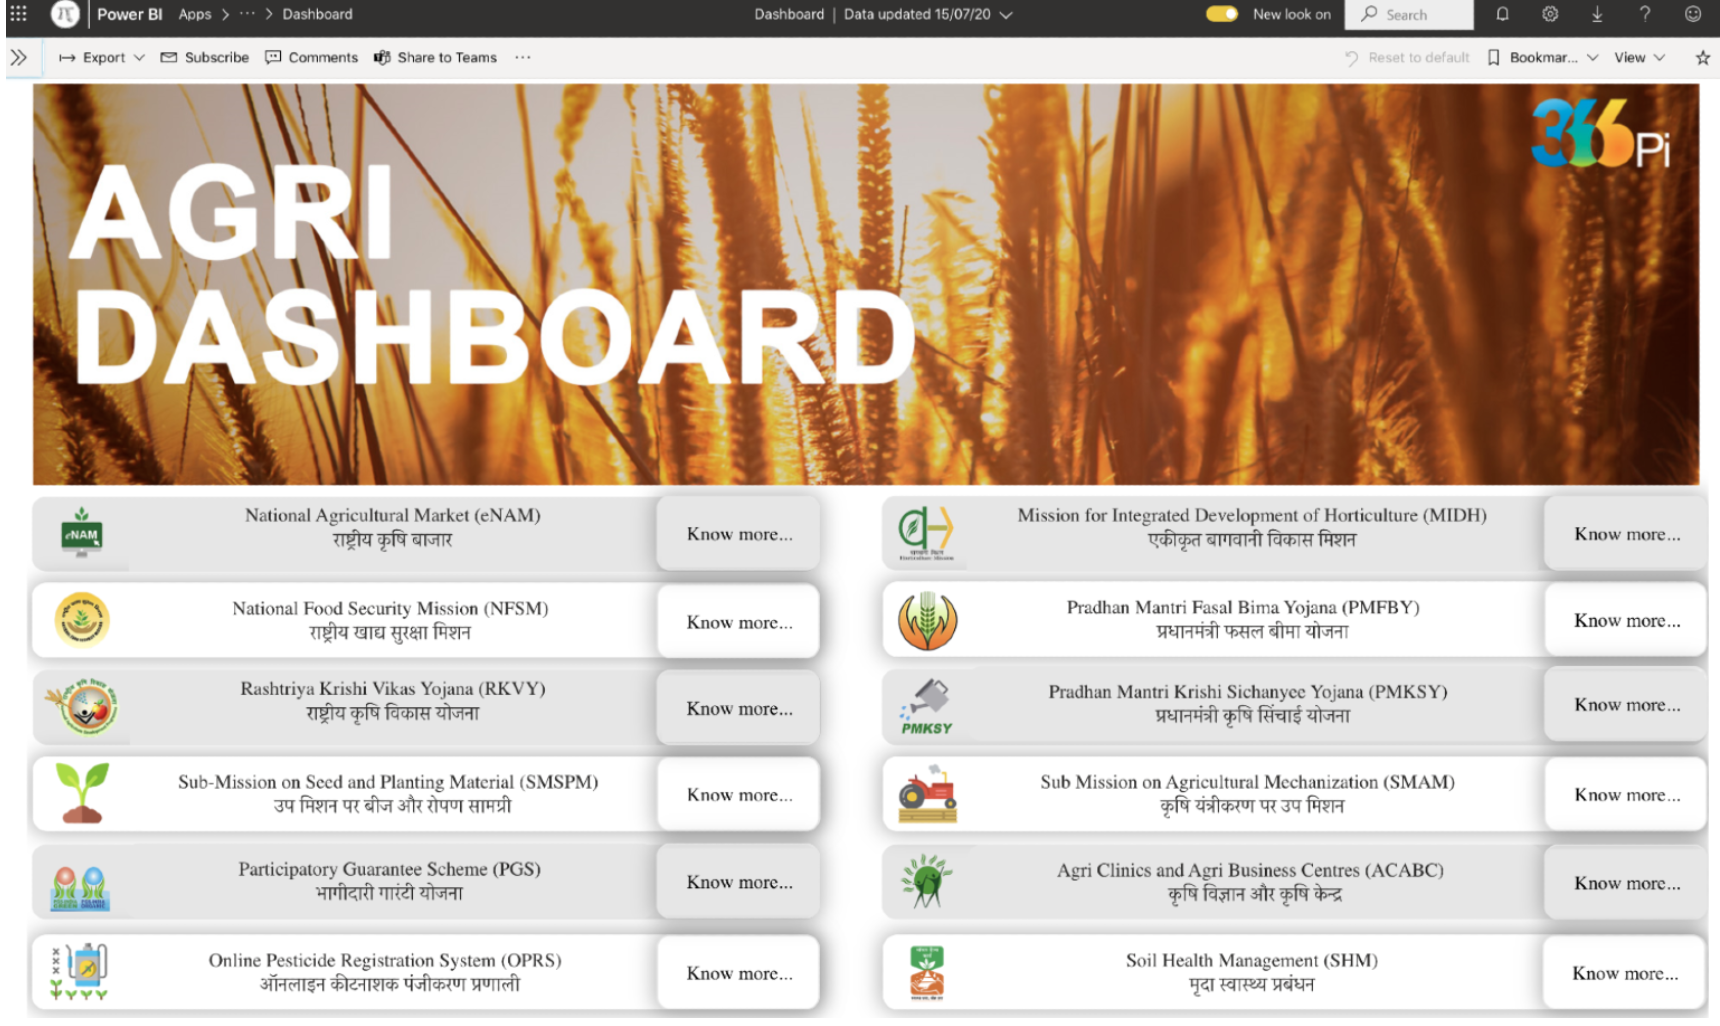
Agriculture in India: Visualization & Analytics is our endeavor to extract insight out of every bit of Agri data for better decision making. The information is presented in a form of dashboard, built using the Power BI platform by Microsoft.
The first release of the dashboard contains information around schemes as mentioned in the image below. Indian agri economy is undergoing structural changes. The share of agriculture has dropped to almost one-fourth of the rural GDP.
Why Agri Dashboard
India, despite being an agrarian economy historically, has witnessed a mass diaspora of people from farm to factories after a manufacturing boom.
Then came the Covid-19 pandemic which changed the outlook of people towards rural, agriculture, and sustenance. Indian agrarian economy has failed to pick momentum due to various reasons. India agri sector needs a fool-proof plan to succeed than cash for farmers.
We are on a mission to support agriculture, farmers, and agribusinesses with data-driven insights, plans, and strategies. Interested in first-hand access of the dashboard?
Write To Us.


Good initiative
Have requested for the report
Will read and come back to you